Tuesday, February 28, 2012

To fund a deficit of 600,000 crores, the RBI might need to print 200,000 crores

Advance Taxes Are Not Enough

December, was when corporates (and individuals) pay another chunk of advance tax. This should have bolstered government revenues, but it seemingly has not. Total tax revenue in December, net of what was paid to the states, was Rs 99,944 crores, just 5.3% above the previous year. For the April to December time period, tax collections are just 7.5% higher.

Consider that India's Gross Domestic Product has grown 16% in "nominal" terms — that is, before inflation is removed. Government tax revenue should grow at the nominal rate (at least), but increasing inflation has eaten substantially into profits and thus, to taxes.

Meanwhile, government expenditure is growing at nearly 14%. No wonder the deficit is now at Rs 3.8 lakh crore, which is already more than 90% of the budgeted deficit for the entire year.

Lower Corporate Profits

Analyzing the December quarter results which are being announced now tells us that corporate profits, from the 400 top companies, have fallen 1.5% from the same quarter a year back. The September quarter was also a declining number. While revenues have grown 26%, expenses have grown even more at 32%. A lower corporate profit number doesn't just cut directly from government revenues, it makes valuations of their stocks lower (and the government owns a large chunk of PSUs).

The Lack of Enough Non-Tax Revenue

Last year, a bulk of non-tax revenue came from selling the 3G and BWA spectrum. This year the government expected to sell equity stakes in public sector companies like ONGC and BHEL, which has not yet happened largely because the government believes the market prices are too low.

The government has tried innovative means of revenue. It has asked government owned companies to buy back their shares with their surplus cash. Nearly 30,000 cr. worth shares of large companies like L&T and Axis bank lie with SUUTI, a special purpose vehicle that was created when US-64, a mutual fund, was bailed out by the government. These could be sold, but prices will drop if the news is public, so the idea is to sell the shares into another SPV and use accounting magic to make the non-tax number. The most innovative, perhaps, was to attempt to charge Vodafone with an income tax order of more than 8,000 cr. after they bought the telecom company, Hutch; the Supreme Court has since ruled against the government.

Bailouts and Oil Subsidies

While expenses are up 14%, they don't include certain large ticket items. The oil deficit — the under-recovery because we price diesel, LPG and kerosene below market prices — is now 97,000 crores, and is likely to grow to about 125,000 crores. A good portion of that will have to be financed by the central government. There is an increase in the acquisition prices of food from farmers, there's more fertilizer subsidy, increase in payments to NREGA, and so on. For the last quarter, there are also bailouts of Air India, additional capital to the public sector banks and the whole election process to keep expenses higher.

Borrowing Impact: Credit and Inflation

Why are deficits bad? After all, what the government can't earn, it will borrow from the markets. What it can't even borrow, the RBI will print. The RBI is using Open Market Operations to buy bonds on the same day the government is issuing new ones — effectively printing money to fund the deficit. This is also what is happening in the US with the Federal Reserve buying bonds, in the UK and Europe, and in Japan. Then why is a deficit a problem?

The often stated problem is that money-printing at this level will stoke inflation. Effectively, to fund a deficit of 600,000 crores, the RBI might need to print 200,000 crores. That is an increase of nearly 15% in our money supply, and if you add another 10-12% from other ways, we'll be expanding money supply by one-fourth every year, a sure shot recipe for higher prices as the money chases the same goods.

Those other countries would love some inflation — but we're dealing with a lot of it, with inflation in double digits as recently as October. Germany and Zimbabwe have seen events of hyperinflation, when inflation was more than 100% a day. That was largely because of the unlimited printing of currency, and the inflationary spiral acts very fast if you cross a boundary. The RBI's actions may "bailout" the government borrowing programme today, but given that they have a strong stance against inflation, RBI is equally likely to increase rates or take up other measures if inflation goes back into double digits.

Increased borrowing also crowds out private credit — if the financiers can lend to the government at a good enough rate, they won't lend to you and me. And eventually, we are a private led economy (the government is less than 25% of our GDP) so the lack of private growth will hurt everyone.

High deficits are unsustainable, as Greece and Portugal are finding out. Regardless of how things might seem, and other news that seem to be grabbing headlines, now is the time for tough decisions. We may need to increase taxes, reduce expenses or find alternate sources of government revenue. We may need to forego some of the populist measures our government pushed down our collective throats. But will this happen or will we run to the new deity in town, the printing press?

Thursday, February 23, 2012

The Peter Lynch Approach to Investing in "Understandable" Stocks

No modern-day investment "sage" is better known than Peter Lynch. Not only has his investment approach successfully passed the real-world performance test, but he strongly believes that individual investors have a distinct advantage over Wall Street and large money managers when using his approach. Individual investors, he feels, have more flexibility in following this basic approach because they are unencumbered by bureaucratic rules and short-term performance concerns. 

Mr. Lynch developed his investment philosophy at Fidelity Management and Research, and gained his considerable fame managing Fidelity's Magellan Fund. The fund was among the highest-ranking stock funds throughout Mr. Lynch's tenure, which began in 1977 at the fund's launching, and ended in 1990, when Mr. Lynch retired. 

Peter Lynch's approach is strictly bottom-up, with selection from among companies with which the investor is familiar, and then through fundamental analysis that emphasizes a thorough understanding of the company, its prospects, its competitive environment, and whether the stock can be purchased at a reasonable price. His basic strategy is detailed in his best-selling book "One Up on Wall Street" [Penguin Books paperback, 1989], which provides individual investors with numerous guidelines for adapting and implementing his approach. His most recent book, "Beating the Street" [Fireside/Simon & Schuster paperback, 1994], amplifies the theme of his first book, providing examples of his approach to specific companies and industries in which he has invested. These are the primary sources for this article. 

The Philosophy: Invest in What You Know 

Lynch is a "story" investor. That is, each stock selection is based on a well-grounded expectation concerning the firm's growth prospects. The expectations are derived from the company's "story"--what it is that the company is going to do, or what it is that is going to happen, to bring about the desired results. 

The more familiar you are with a company, and the better you understand its business and competitive environment, the better your chances of finding a good "story" that will actually come true. For this reason, Lynch is a strong advocate of investing in companies with which one is familiar, or whose products or services are relatively easy to understand. Thus, Lynch says he would rather invest in "pantyhose rather than communications satellites," and "motel chains rather than fiber optics." 

Lynch does not believe in restricting investments to any one type of stock. His "story" approach, in fact, suggests the opposite, with investments in firms with various reasons for favorable expectations. In general, however, he tends to favor small, moderately fast-growing companies that can be bought at a reasonable price. 

Selection Process 

Lynch's bottom-up approach means that prospective stocks must be picked one-by-one and then thoroughly investigated--there is no formula or screen that will produce a list of prospective "good stories." Instead, Lynch suggests that investors keep alert for possibilities based on their own experiences--for instance, within their own business or trade, or as consumers of products. 

The next step is to familiarize yourself thoroughly with the company so that you can form reasonable expectations concerning the future. However, Lynch does not believe that investors can predict actual growth rates, and he is skeptical of analysts' earnings estimates. 

Instead, he suggests that you examine the company's plans--how does it intend to increase its earnings, and how are those intentions actually being fulfilled? Lynch points out five ways in which a company can increase earnings: It can reduce costs; raise prices; expand into new markets; sell more in old markets; or revitalize, close, or sell a losing operation. 

The company's plan to increase earnings and its ability to fulfill that plan are its "story," and the more familiar you are with the firm or industry, the better edge you have in evaluating the company's plan, abilities, and any potential pitfalls. 

Categorizing a company, according to Lynch, can help you develop the "story" line, and thus come up with reasonable expectations. He suggests first categorizing a company by size. Large companies cannot be expected to grow as quickly as smaller companies. 

Next, he suggests categorizing a company by "story" type, and he identifies six:  

• Slow Growers: Large and aging companies expected to grow only slightly faster than the U.S. economy as a whole, but often paying large regular dividends. These are not among his favorites.  

• Stalwarts: Large companies that are still able to grow, with annual earnings growth rates of around 10% to 12%; examples include Coca-Cola, Procter & Gamble, and Bristol-Myers. If purchased at a good price, Lynch says he expects good but not enormous returns--certainly no more than 50% in two years and possibly less. Lynch suggests rotating among the companies, selling when moderate gains are reached, and repeating the process with others that haven't yet appreciated. These firms also offer downside protection during recessions.  

• Fast-Growers: Small, aggressive new firms with annual earnings growth of 20% to 25% a year. These do not have to be in fast-growing industries, and in fact Lynch prefers those that are not. Fast-growers are among Lynch's favorites, and he says that an investor's biggest gains will come from this type of stock. However, they also carry considerable risk.  

• Cyclicals: Companies in which sales and profits tend to rise and fall in somewhat predictable patterns based on the economic cycle; examples include companies in the auto industry, airlines and steel. Lynch warns that these firms can be mistaken for stalwarts by inexperienced investors, but share prices of cyclicals can drop dramatically during hard times. Thus, timing is crucial when investing in these firms, and Lynch says that investors must learn to detect the early signs that business is starting to turn down.  

• Turnarounds: Companies that have been battered down or depressed--Lynch calls these "no-growers"; his examples include Chrysler, Penn Central and General Public Utilities (owner of Three Mile Island). The stocks of successful turnarounds can move back up quickly, and Lynch points out that of all the categories, these upturns are least related to the general market.  

• Asset opportunities: Companies that have assets that Wall Street analysts and others have overlooked. Lynch points to several general areas where asset plays can often be found--metals and oil, newspapers and TV stations, and patented drugs. However, finding these hidden assets requires a real working knowledge of the company that owns the assets, and Lynch points out that within this category, the "local" edge--your own knowledge and experience--can be used to greatest advantage.  

Selection Criteria 

Analysis is central to Lynch's approach. In examining a company, he is seeking to understand the firm's business and prospects, including any competitive advantages, and evaluate any potential pitfalls that may prevent the favorable "story" from occurring. In addition, an investor cannot make a profit if the story has a happy ending but the stock was purchased at a too-high price. For that reason, he also seeks to determine reasonable value. 

Here are some of the key numbers Lynch suggests investors examine: 

Year-by-year earnings: The historical record of earnings should be examined for stability and consistency. Stock prices cannot deviate long from the level of earnings, so the pattern of earnings growth will help reveal the stability and strength of the company. Ideally, earnings should move up consistently. 

Earnings growth: The growth rate of earnings should fit with the firm's "story"--fast-growers should have higher growth rates than slow-growers. Extremely high levels of earnings growth rates are not sustainable, but continued high growth may be factored into the price. A high level of growth for a company and industry will attract a great deal of attention from both investors, who bid up the stock, and competitors, who provide a more difficult business environment. 

The price-earnings ratio: The earnings potential of a company is a primary determinant of company value, but at times the market may get ahead of itself and overprice a stock. The price-earnings ratio helps you keep your perspective, by comparing the current price to most recently reported earnings. Stocks with good prospects should sell with higher price-earnings ratios than stocks with poor prospects. 

The price-earnings ratio relative to its historical average: Studying the pattern of price-earnings ratios over a period of several years should reveal a level that is "normal" for the company. This should help you avoid buying into a stock if the price gets ahead of the earnings, or sends an early warning that it may be time to take some profits in a stock you own.  

The price-earnings ratio relative to the industry average: Comparing a company's price-earnings ratio to the industry's may help reveal if the company is a bargain. At a minimum, it leads to questions as to why the company is priced differently--is it a poor performer in the industry, or is it just neglected? 

The price-earnings ratio relative to its earnings growth rate: Companies with better prospects should sell with higher price-earnings ratios, but the ratio between the two can reveal bargains or overvaluations. A price-earnings ratio of half the level of historical earnings growth is considered attractive, while relative ratios above 2.0 are unattractive. For dividend-paying stocks, Lynch refines this measure by adding the dividend yield to the earnings growth [in other words, the price-earnings ratio divided by the sum of the earnings growth rate and dividend yield]. With this modified technique, ratios above 1.0 are considered poor, while ratios below 0.5 are considered attractive.  

Ratio of debt to equity : How much debt is on the balance sheet? A strong balance sheet provides maneuvering room as the company expands or experiences trouble. Lynch is especially wary of bank debt, which can usually be called in by the bank on demand.  

Net cash per share: Net cash per share is calculated by adding the level of cash and cash equivalents, subtracting long-term debt, and dividing the result by the number of shares outstanding. High levels provide a support for the stock price and indicate financial strength.   

Dividends & payout ratio: Dividends are usually paid by the larger companies, and Lynch tends to prefer smaller growth firms. However, Lynch suggests that investors who prefer dividend-paying firms should seek firms with the ability to pay during recessions (indicated by a low percentage of earnings paid out as dividends), and companies that have a 20-year or 30-year record of regularly raising dividends.  

Inventories: Are inventories piling up? This is a particularly important figure for cyclicals. Lynch notes that, for manufacturers or retailers, an inventory buildup is a bad sign, and a red flag is waving when inventories grow faster than sales. On the other hand, if a company is depressed, the first evidence of a turnaround is when inventories start to be depleted.  

When evaluating companies, there are certain characteristics that Lynch finds particularly favorable. These include:  

• The name is boring, the product or service is in a boring area, the company does something disagreeable or depressing, or there are rumors of something bad about the company--Lynch likes these kinds of firms because their ugly duckling nature tends to be reflected in the share price, so good bargains often turn up. Examples he mentions include: Service Corporation International (a funeral home operator--depressing); and Waste Management (a toxic waste clean-up firm--disagreeable).  

• The company is a spin-off--Lynch says these often receive little attention from Wall Street, and he suggests that investors check them out several months later to see if insiders are buying.  

• The fast-growing company is in a no-growth industry--Growth industries attract too much interest from investors (leading to high prices) and competitors.  

• The company is a niche firm controlling a market segment or that would be difficult for a competitor to enter.  

• The company produces a product that people tend to keep buying during good times and bad--such as drugs, soft drinks, and razor blades--More stable than companies whose product sales are less certain. 

• The company is a user of technology--These companies can take advantage of technological advances, but don't tend to have the high valuations of firms directly producing technology, such as computer firms.  

• There is a low percentage of shares held by institutions, and there is low analyst coverage--Bargains can be found among firms neglected by Wall Street.  

• Insiders are buying shares--A positive sign that insiders feel particularly confident about the firm's prospects.  

• The company is buying back shares--Buybacks become an issue once companies start to mature and have cash flow that exceeds their capital needs. Lynch prefers companies that buy their shares back over firms that choose to expand into unrelated businesses. The buyback will help to support the stock price and is usually performed when management feels share price is favorable.  

Characteristics Lynch finds unfavorable are:  

• Hot stocks in hot industries.  

• Companies (particularly small firms) with big plans that have not yet been proven.  

• Profitable companies engaged in diversifying acquisitions. Lynch terms these "diworseifications."  

• Companies in which one customer accounts for 25% to 50% of their sales.  

Portfolio Building and Monitoring 

As portfolio manager of Magellan, Lynch held as many as 1,400 stocks at one time. Although he was successful in juggling this many stocks, he does point to significant problems of managing such a large number of stocks. Individual investors, of course, will get nowhere near that number, but he is wary of over-diversification just the same. There is no point in diversifying just for the sake of diversifying, he argues, particularly if it means less familiarity with the firms. Lynch says investors should own however many "exciting prospects" that they are able to uncover that pass all the tests of research. Lynch also suggests investing in several categories of stocks as a way of spreading the downside risk. On the other hand, Lynch warns against investment in a single stock. 

Lynch is an advocate of maintaining a long-term commitment to the stock market. He does not favor market timing, and indeed feels that it is impossible to do so. But that doesn't necessarily mean investors should hold onto a single stock forever. Instead, Lynch says investors should review their holdings every few months, rechecking the company "story" to see if anything has changed either with the unfolding of the story or with the share price. 

The key to knowing when to sell, he says, is knowing "why you bought it in the first place." 

Lynch says investors should sell if:  

• The story has played out as expected and this is reflected in the price; for instance, the price of a stalwart has gone up as much as could be expected.  

• Something in the story fails to unfold as expected or the story changes, or fundamentals deteriorate; for instance, a cyclical's inventories start to build, or a smaller firm enters a new growth stage.

For Lynch, a price drop is an opportunity to buy more of a good prospect at cheaper prices. It is much harder, he says, to stick with a winning stock once the price goes up, particularly with fast-growers where the tendency is to sell too soon rather than too late. With these firms, he suggests holding on until it is clear the firm is entering a different growth stage. 

Rather than simply selling a stock, Lynch suggests "rotation"--selling the company and replacing it with another company with a similar story, but better prospects. The rotation approach maintains the investor's long-term commitment to the stock market, and keeps the focus on fundamental value. 

Summing It Up 

Lynch offers a practical approach that can be adapted by many different types of investors, from those emphasizing fast growth to those who prefer more stable, dividend-producing investments. His strategy involves considerable hands-on research, but his books provide lots of practical advice on what to look for in an individual firm, and how to view the market as a whole. 

Lynch sums up stock investing and his outlook best:  

"Frequent follies notwithstanding, I continue to be optimistic about America, Americans, and investing in general. When you invest in stocks, you have to have a basic faith in human nature, in capitalism, in the country at large, and in future prosperity in general. So far, nothing's been strong enough to shake me out of it." 

Saturday, February 11, 2012

All Central Bank Balance Sheets Are Exploding Higher, Or Engaged In QE

All Central Bank Balance Sheets Are Exploding Higher, Or Engaged In QE

The degree to which central banks around the world are printing money is unprecedented.

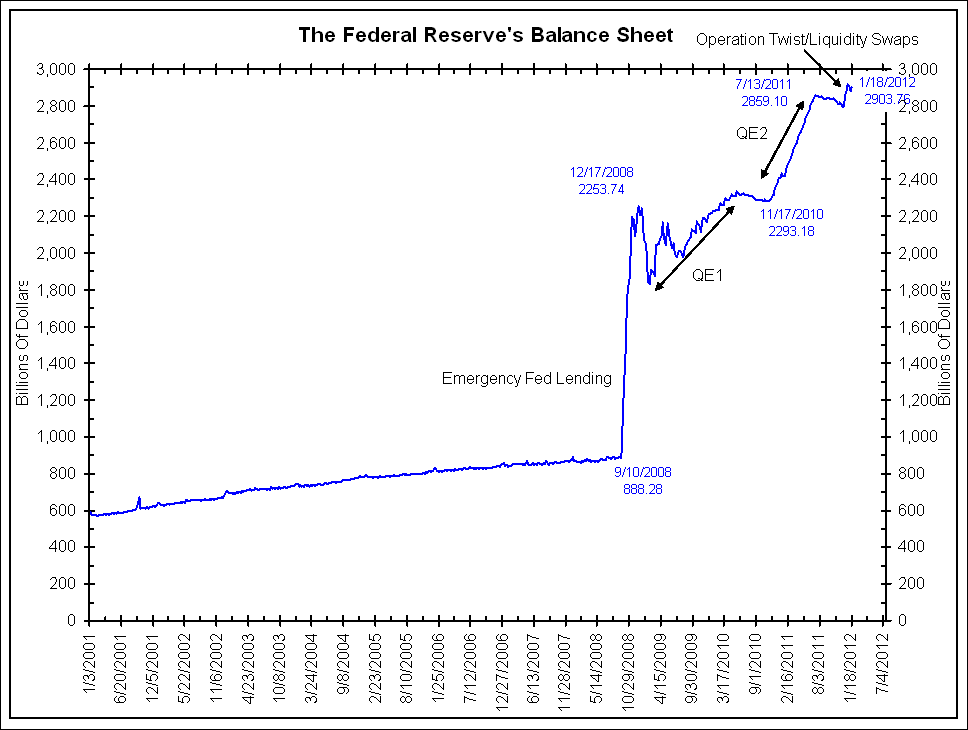
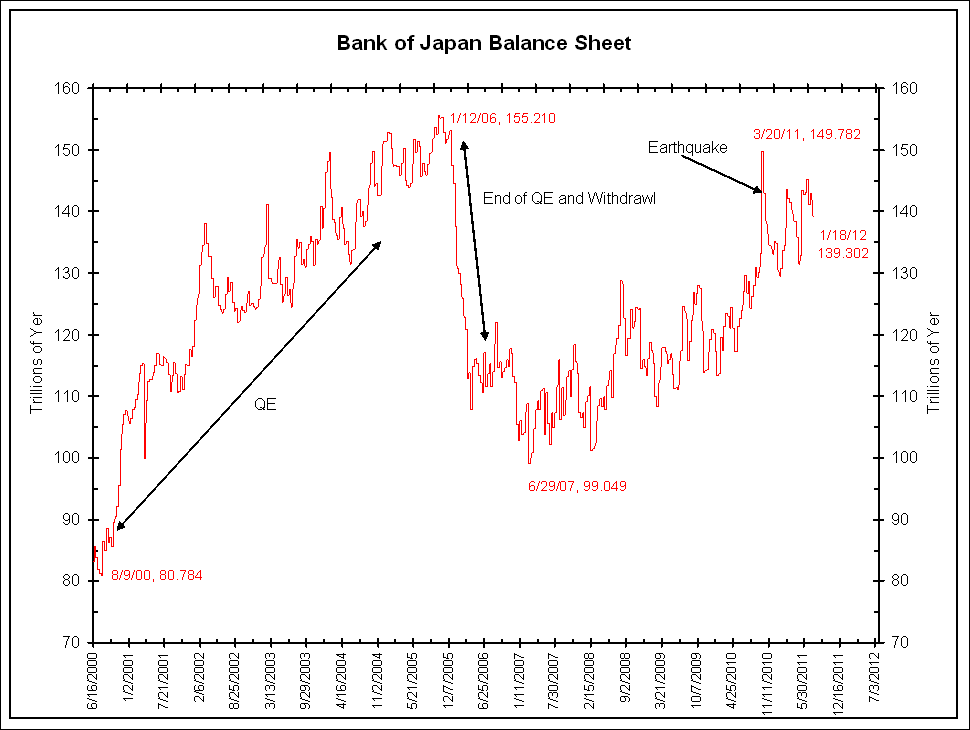
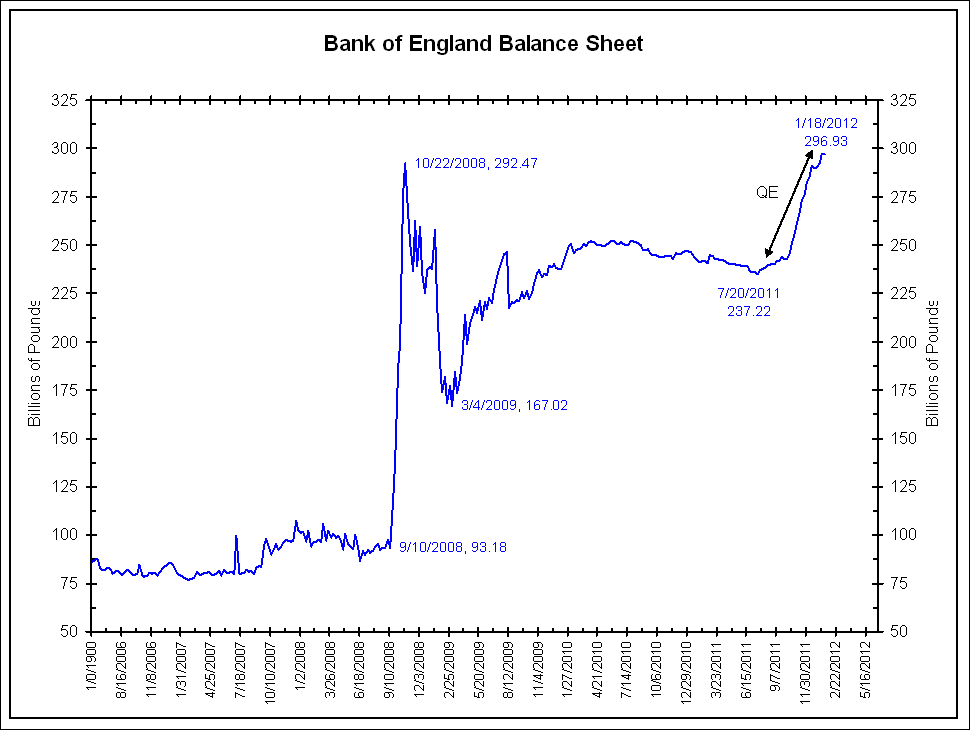
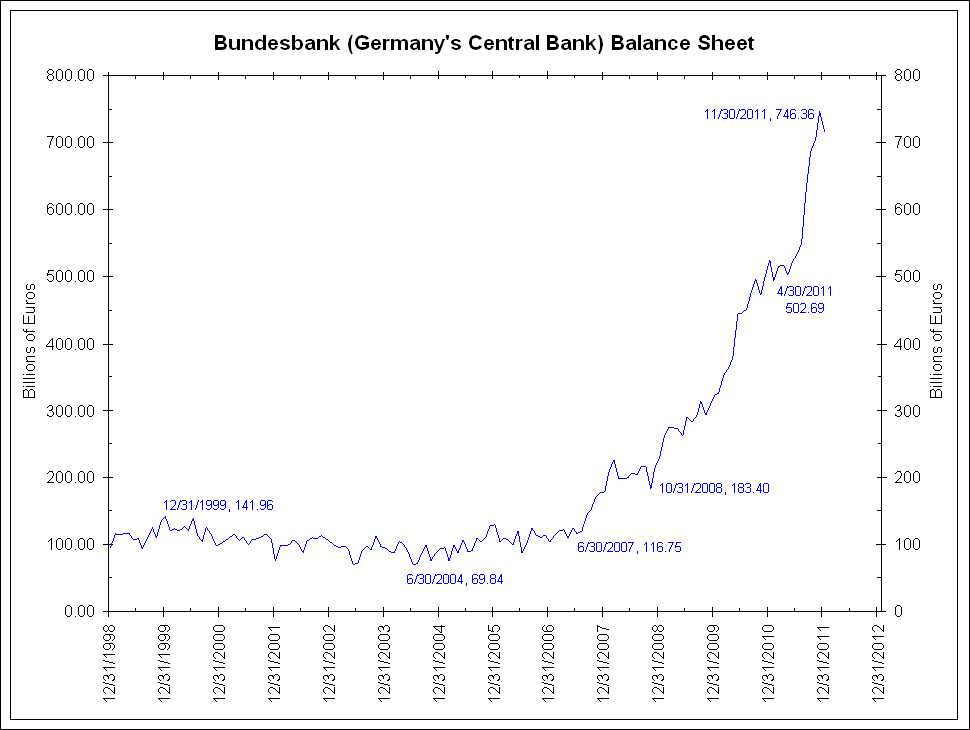
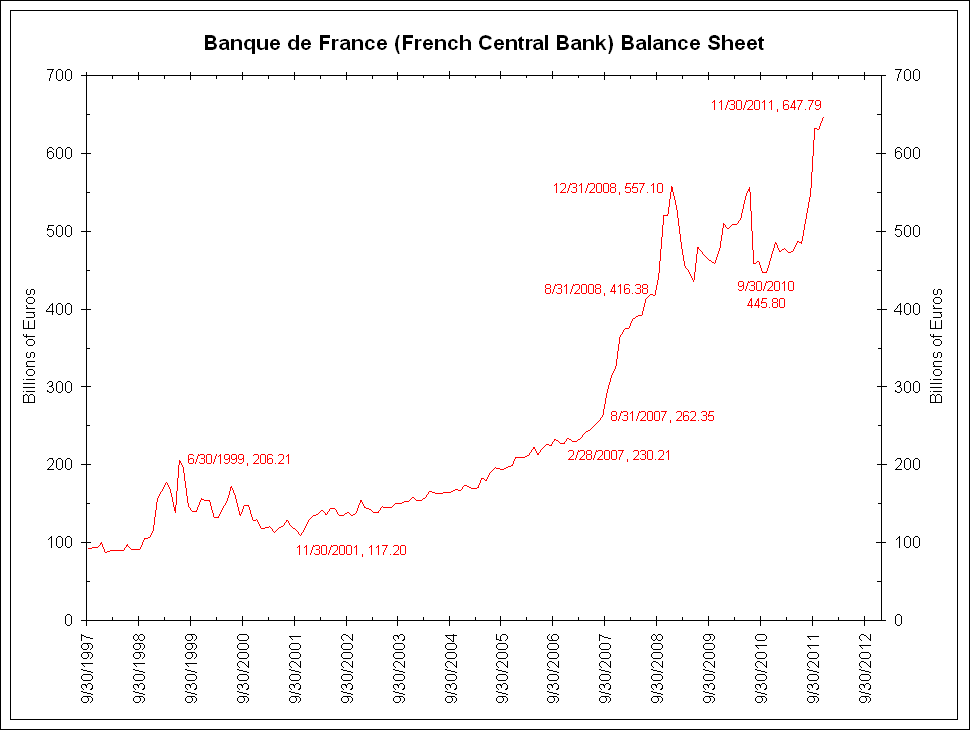
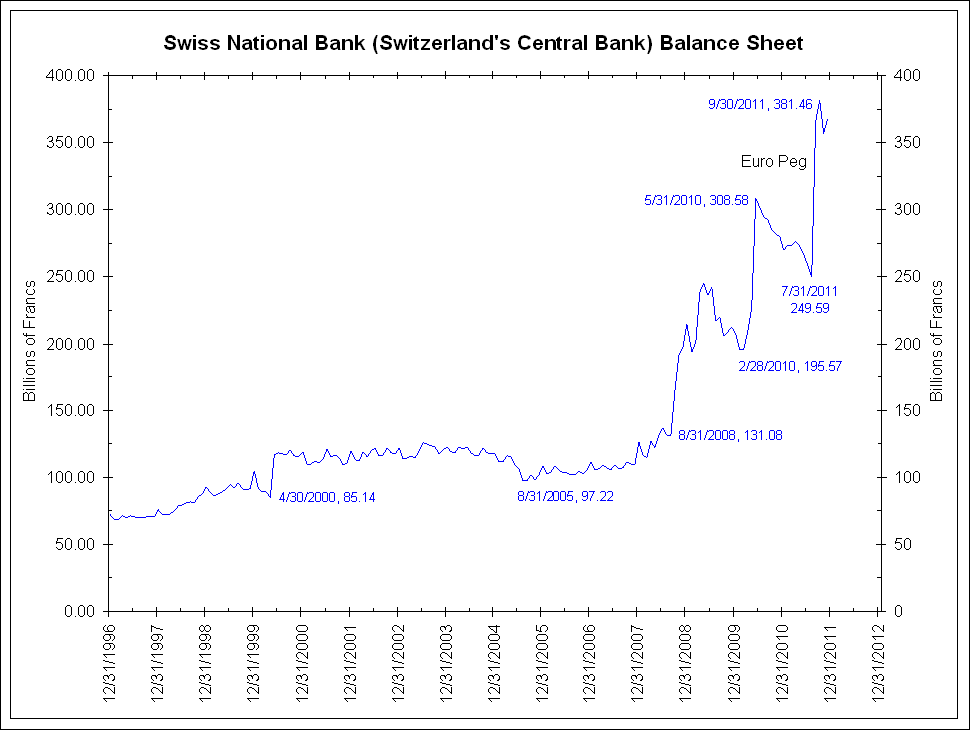
The first eight charts below show the balance sheets of the largest central banks in the world. They are the European Central Bank (ECB), the Federal Reserve (Fed), the Bank of Japan (BoJ), the Bank of England (BoE), the Bundesbank (Germany), the Banque de France, the People's Bank of China (PBoC) and the Swiss National Bank (SNB).  Noted on the charts are significant events or growth rates.

Shown is the size of each respective balance sheet in its local currency.  Note that all are exploding higher as every chart goes from the lower left to the upper right.  Most are still making new all-time highs. If the basic definition of quantitative easing (QE) is a significant increase in a central bank's balance sheet via increasing banking reserves, then all eight of these central banks are engaged in QE.

>

Click to enlarge:

˜˜˜

˜˜˜

˜˜˜

˜˜˜

˜˜˜

˜˜˜

>

Comparing Central Bank Balance Sheets

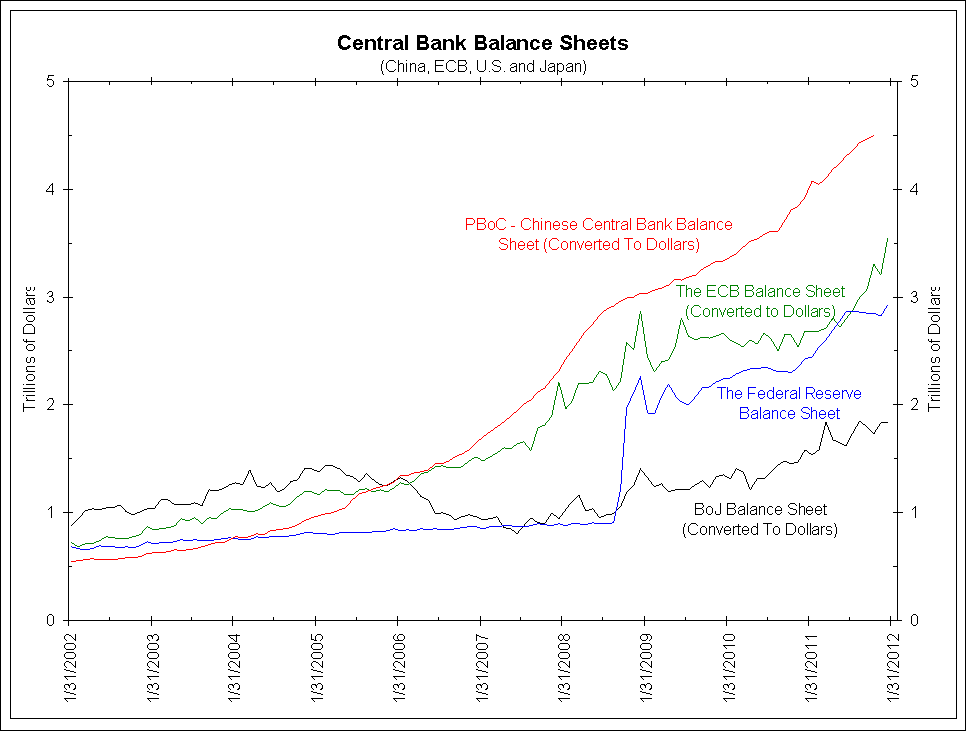
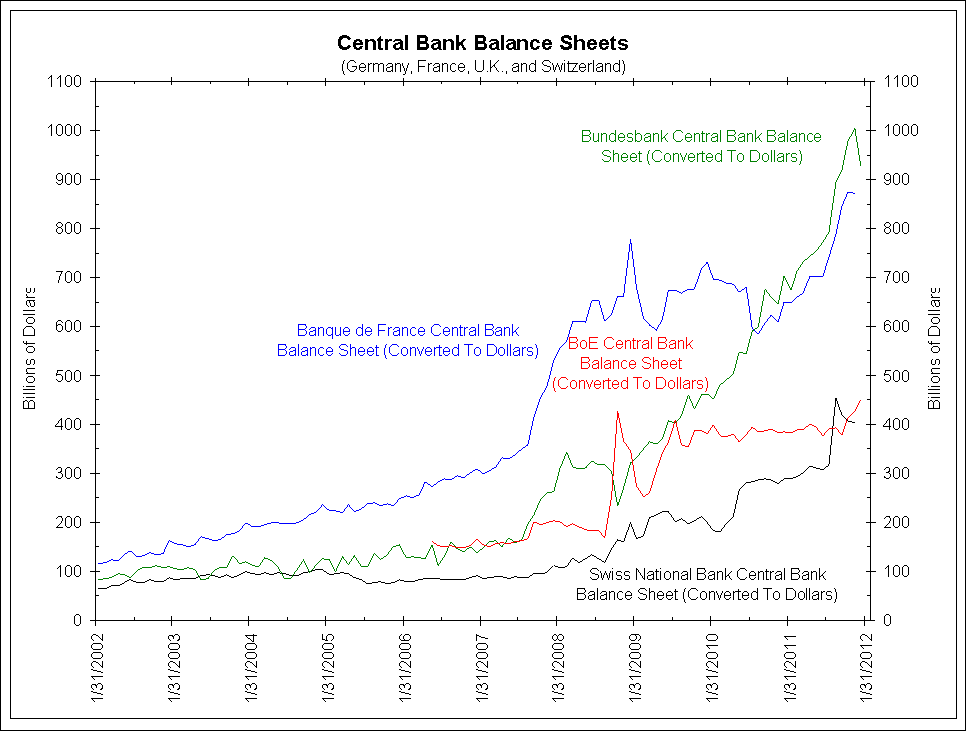
For comparison's sake, converted the eight balance sheets above into dollar terms.  The four largest, the PBoC, the Fed, the BoJ and the ECB are shown in the first chart below.  The second four, the Bundesbank, Banque de France, the BoE and SNB are shown in the second chart below.  I split them up because of their vastly different scales.

In the first chart, note that the balance sheets of the PBoC and the ECB are larger than the Federal Reserve when converted to dollars.  The BoJ used to be the largest balance sheet in dollar terms until 2006.

When shown in dollar terms below, the Bundesbank is the largest of the "second four" central banks.  Further, its growth rate over the last five years has been among the highest.  This is surprising since the Bundesbank is considered the "hard money" central bank.

Combining Central Bank Balance Sheets

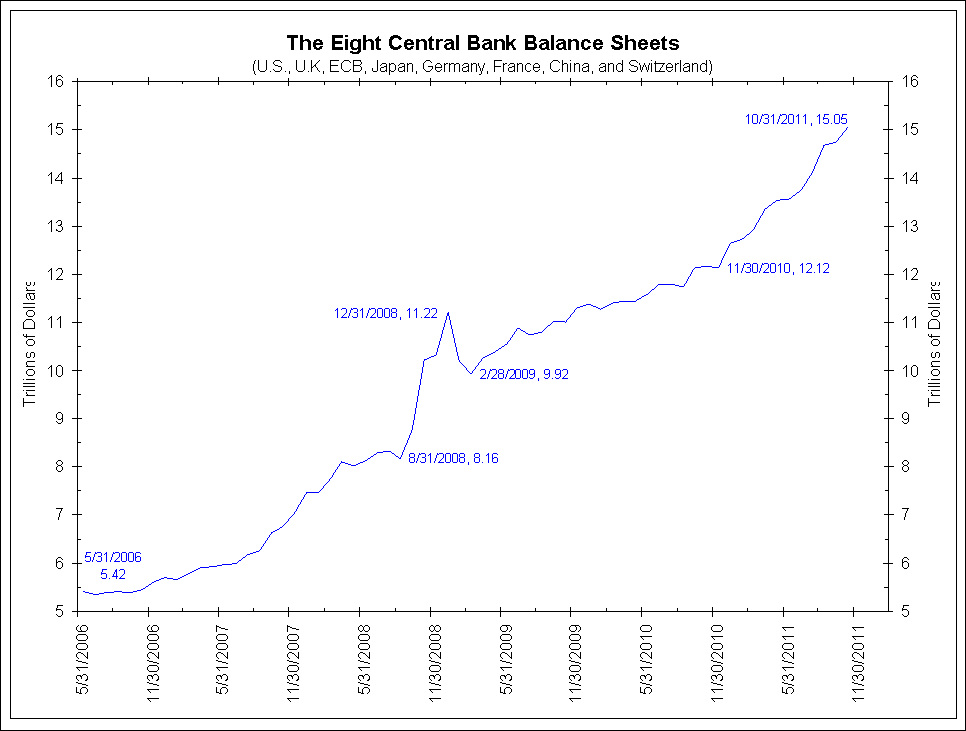
The next chart below adds up the eight largest central bank balance sheets in dollar terms.  It is only current through October as that is the latest number from the PBoC.

The combined size of these eight central banks' balance sheets has almost tripled in the last six years from $5.42 trillion to more than $15 trillion and is still on the rise!

Central Banks Equal To One-Third Of World Equity Values

As noted above, QE is an expanding of balance sheets via increasing bank reserves.  The purpose of QE, as explained by this Bank of England video,  is to increase bank reserves through purchases of fixed income securities in order to lower interest rates.  This makes fixed income securities relatively unattractive/overvalued and pushes investors out the risk curve.  This should increase buying for riskier assets such as stocks, pushing them higher in price.  Theoretically these higher prices should lead to a wealth effect and increased economic activity.

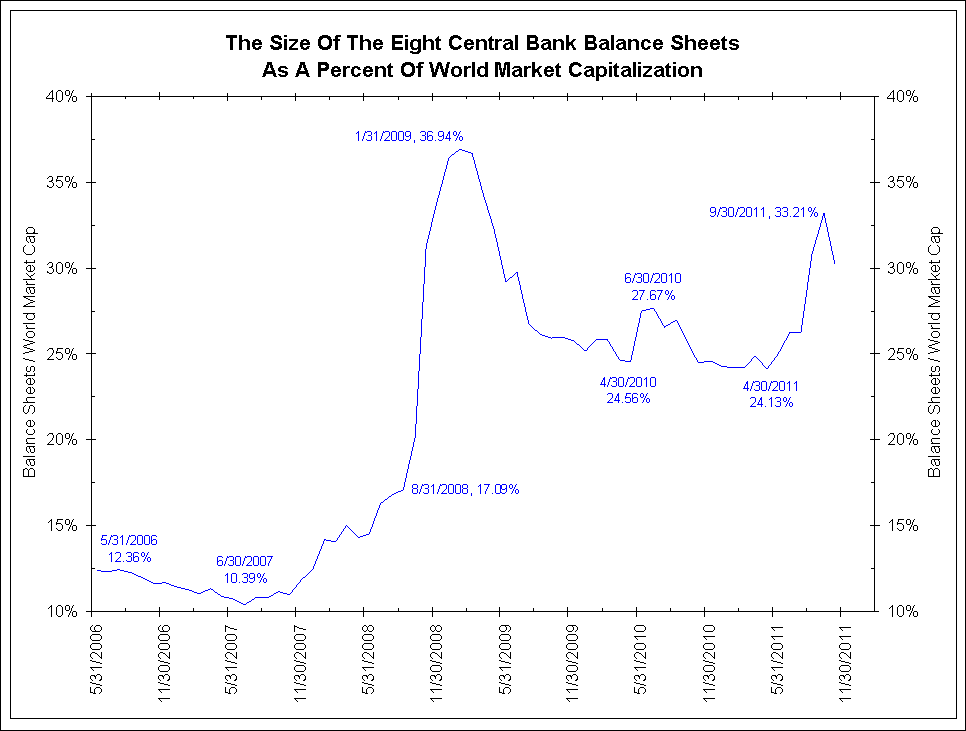
Given this definition and purpose, it is fair to compare the size of these balance sheets (now $15 trillion) to the capitalization of the world's stock markets (now $48 trillion).  This is shown in the chart below.

Prior to the 2008 financial crisis, the eight central bank balance sheets were less than 15% the size of world stock markets and falling.  In the immediate aftermath of Lehman Brothers' failure, these eight central bank balance sheets swelled to 37% the capitalization of the world stock market.  But keep in mind that the late 2008/early 2009 peak was due to collapsing stock market values combined with balance sheet expansion via "lender of last resort" loans.

Recently, the eight central bank balance sheets have spiked back to 33% of world stock market capitalization.  This has come about not by lender of last resort loans, but rather by QE expansion (buying bonds with "printed money") even faster than world stock markets are rising.

What Does It All Mean?

2011 was so difficult because all stocks seemingly moved together.  It was as if every S&P 500 company had the same chairman of the board that knew only one strategy, resulting in a high degree of correlation between seemingly unrelated companies.

Massive central bank involvement in the markets risks returning us to a de facto centrally planned economy. Those S&P 500 companies all have the same chairman; it is Ben Bernanke because his policies are affecting everybody. That is what makes money management so difficult. Correlations will ebb and flow; they always do. But what makes them go away? This will only happen when governments and central banks go away.

But if they go away, then does that not mean things get ugly? Maybe they do get ugly, but it also means that we sort out the excesses in the market. We reward the people that do the right thing and we punish the people that do the wrong thing. And we have an adjustment process that may be ugly, but then we have a period of long expansion.

Central banks are ruling markets to a degree this generation has not seen.  Collectively they are printing money to a degree never seen in human history.

So how does this process get reversed?  How do central banks pull back trillions of dollars of money printing without throwing markets into a tailspin?  Frankly, no one knows, least of all central banks as they continue to make new money printing records.

Until a worldwide exit strategy can be articulated and understood, risk markets will rise and fall based on the perceptions and realities of central bank balance sheets. As long as this is perceived to be a good thing, like perpetually rising home prices were perceived to be a good thing, risk markets will rise.

When/If these central banks go too far, as was eventually the case with home prices, expanding balance sheets will no longer be looked upon in a positive light.  Instead they will be viewed in the same light as CDOs backed by sub-prime mortgages were when home prices were falling.  The heads of these central banks will no longer be put on a pedestal but looked upon as eight Alan Greenspans that caused a financial crisis.

The tipping point between balance sheet expansion being bullish for risk assets versus bearish is impossible to know.  Given the growth rate of central bank balance sheets around the world over the past few years, we might not have to wait too long to find out.  Enjoy it while it is still bullish.

Thursday, January 26, 2012

IMF warns of another great depression

MARK COLVIN: The International Monetary Fund says the world economy is in danger of another 1930s crash.

It would see countries defaulting on their debt and widespread panic on global financial markets.

The IMF forecast came after European finance ministers failed to reach a debt restructuring agreement with private bond holders in Greece last night.

As David Taylor reports there are now just weeks remaining before Greece's economy reaches the point of no return.

DAVID TAYLOR: European finance leaders are running out of time. Last night saw yet another failure of European ministers to negotiate a plan to keep private bond holders at bay.

Key figures from the leadership team commissioned to solve the crisis are no longer shy about where they see things are headed.

CHRISTINE LAGARDE: We could easily, easily, slide into what we call a 1930s moment. A moment where trust and cooperation break down and countries turn inward. A moment ultimately leading to a downward spiral that could very much engulf the entire world. 

DAVID TAYLOR: International Monetary Fund managing director Christine Lagarde.

But they're not giving up without a fight.

CHRISTINE LAGARDE: I believe that we can avoid such a scenario. I say this for a simple reason; because we know what must be done. 

DAVID TAYLOR: That includes increasing the size of the massive European bailout fund and imposing fire walls around the more robust European economies to prevent financial contagion, a financial contagion that could eventuate if Greece suffers a disorderly default on its debt.

At this point, that's exactly where we are headed. 

Last night a group representing private Greek investors met with finance ministers to negotiate new terms for their holdings.

The authorities need the investors to accept some pretty dismal returns on their investments, huge losses to be exact. Understandably they're reluctant to do that but they may have no choice.

Russell Jones is the global head of fixed income strategy at the Westpac Bank.

RUSSELL JONES: To allow that to happen you have to have an interest rate which is comfortable for them. If it's too high, quite simply they will default on their bonds, they won't pay anybody back anything and that's not what the authorities want. 

DAVID TAYLOR: But as investors walked away from the negotiating table last night, they increased the chance they'll receive absolutely nothing. That's because Greece is unlikely to receive any more aid money if it's unable to strike a deal with those debt investors. That would leave Greece facing complete financial collapse by the end of March.

RUSSELL JONES: There has to be something done by around the third week in March because at that stage the Greeks have got a very large payment that they have to make. 

So that is the absolute deadline for any negotiations on this issue. And clearly they would like to have something in place somewhere before that if they possibly could.

DAVID TAYLOR: And if they don't meet that deadline Greece defaults?

RUSSELL JONES: Greece defaults and not in an orderly way, in a very disorderly way. And the danger with that is it sparks another round of very bad contagion to other countries in the euro zone. They get tarred with the same sort of brush as Greece. It could be a very, very difficult period for financial markets.

DAVID TAYLOR: Fact is strategists at this point are genuinely uncertain about what lies ahead.

RUSSELL JONES: We haven't had a default in a major industrial nation since the Second World War. This is not something we're very used to. It's not something that policy makers are necessarily comfortable with. In fact they're very uncomfortable with it. We don't know what the connotations will be. It's a very uncertain process. 

DAVID TAYLOR: What is certain however is what investors are looking for Greece to achieve in the next 10 years, if of course it can make it through the next couple of months.

Berenberg Bank senior economist Christian Schulz.

CHRISTIAN SCHULZ: Is Greece going to be able to regain competitiveness within the euro? Is Greece going to have a sustainable debt level after 2020?

DAVID TAYLOR: Questions that wouldn't carry so much weight if much of the euro zone wasn't dependent on Greece's ultimate economic survival.

The fear is if Greece falls, other, larger economies like Italy will also bite the dust; a scenario nobody can afford.

Friday, December 16, 2011

A currency future(FX future)

A currency future, also known as FX future, is a futures contract to exchange one currency for another at a specified date in the future at a price (exchange rate) that is fixed on the purchase date. In India, on NSE the price of a future contract is in terms of INR per unit of other currency e.g. US Dollars. Currency future contracts allow investors to hedge against foreign exchange risk. Currency Derivatives are available on four currency pairs viz. US Dollars (USD), Euro (EUR), Great Britain Pound (GBP) and Japanese Yen (JPY). Currency options are currently available on US Dollars.


NSE was the first exchange to have received an in-principle approval from SEBI for setting up currency derivative segment. The exchange launched its currency futures trading platform on 29th August, 2008. Currency futures on USD-INR were introduced for trading and subsequently the Indian rupee was allowed to trade against other currencies such as euro, pound sterling and the Japanese yen. Currency Options was introduced on October 29, 2010.


National Securities Clearing Corporation Limited (NSCCL) is the clearing and settlement agency for all deals executed on the Currency Derivatives segment. NSCCL acts as legal counter-party to all deals on NSE's Currency Derivatives segment and guarantees settlement.

A Clearing Member (CM) of NSCCL has the responsibility of clearing and settlement of all deals executed by Trading Members (TM) on NSE, who clear and settle such deals through them.


Settlement of daily mark to market is carried out on T+1 day basis.

Final Settlement is carried out on T+2day basis.


Members with a funds pay-in obligation are required to have clear funds in their primary clearing account on or before 8.30 a.m. on the settlement day. The payout of funds is credited to the primary clearing account of the members thereafter.


Daily Settlement Price for mark to market settlement of futures contracts

Daily settlement price for futures contracts is the closing price of such contracts on the trading day. The closing price for a futures contract shall be calculated on the basis of the last half an hour weighted average price of such contract or such other price as may be decided by the relevant authority from time to time.


Theoretical daily settlement price for unexpired futures contracts which are not traded during the last half an hour on a day


Theoretical daily settlement price for unexpired futures contracts, which are not traded during the last half an hour on a day, shall be the price computed as per the formula:

F0=S0 e(r-r) fT

where:

F0 = Theoretical futures price
S0 = Value of the underlying
r = Cost of financing (using continuously compounded interest rate)
rf = Foreign risk free interest rate
T = Time till expiration
e = 2.71828

Rate of interest (r) may be the relevant MIFOR rate or such other rate as may be specified by the Clearing Corporation from time to time.

Foreign risk free interest rate is the relevant LIBOR rate or such other rate as may be specified by the Clearing Corporation from time to time.


Final Settlement Price for mark to market settlement of futures contracts:

Final settlement price for a futures contract for the various currencies shall be as mentioned below, or as may be specified by the relevant authority from time to time.


USDINR

EURINR

GBPINR

JPYINR

Final settlement price

RBI reference rate

RBI reference rate

Exchange rate published by RBI in its Press Release captioned RBI reference Rate for US$ and Euro

Exchange rate published by RBI in its Press Release captioned RBI reference Rate for US$ and Euro

Settlement of futures contracts on currency


Daily Mark-to-Market Settlement

The position in the futures contracts for each member is marked-to-market to the daily settlement price of the futures contracts at the end of each trade day.

The profits/ losses are computed as the difference between the trade price or the previous day's settlement price, as the case may be, and the current day's settlement price. The CMs who have suffered a loss are required to pay the mark-to-market loss amount to NSCCL, which is passed on to the members who have made a profit. This is known as daily mark-to-market settlement.

Theoretical daily settlement price for unexpired futures contracts, which are not traded during the last half an hour on a day, is currently the price computed as per the formula.

After daily settlement, all the open positions are reset to the daily settlement price.

CMs are responsible to collect and settle the daily mark to market profits/losses incurred by the TMs and their clients clearing and settling through them. The pay-in and pay-out of the mark-to-market settlement is on T+1 day (T = Trade day). The mark to market losses or profits are directly debited or credited to the CMs clearing bank account.


Final Settlement

On the expiry of the futures contracts, NSCCL marks all positions of a CM to the final settlement price and the resulting profit / loss is settled in cash.

The final settlement profit / loss is computed as the difference between trade price or the previous day's settlement price, as the case may be, and the RBI reference rate of the such futures contract on the last trading day.

Final settlement loss/ profit amount is debited/ credited to the relevant CMs clearing bank account on T+2 day (T= last trading day).

Open positions in futures contracts cease to exist after their last trading day.


NSCCL has developed a comprehensive risk containment mechanism for the Currency derivatives segment. The most critical component of a risk containment mechanism for NSCCL is the online position monitoring and margining system. The actual margining and position monitoring is done on-line, on an intra-day basis. NSCCL uses the SPAN' (Standard Portfolio Analysis of Risk) system for the purpose of margining, which is a portfolio based system.


Initial Margin

NSCCL collects initial margin up-front for all the open positions of a CM based on the margins computed by NSCCL-SPAN'. A CM is in turn required to collect the initial margin from the TMs and his respective clients. Similarly, a TM is required to collect upfront margins from his clients.

Initial margin requirements are based on 99% value at risk over a one day time horizon. However, in the case of futures contracts, where it may not be possible to collect mark to market settlement value, before the commencement of trading on the next day, the initial margin is computed over a two-day time horizon, applying the appropriate statistical formula. The methodology for computation of Value at Risk percentage is as per the recommendations of SEBI from time to time.

Initial margin requirement for a member:

  • For client positions - is netted at the level of individual client and grossed across all clients, at the Trading/ Clearing Member level, without any setoffs between clients.
  • For proprietary positions - is netted at Trading/ Clearing Member level without any setoffs between client and proprietary positions.

For the purpose of SPAN Margin, various parameters are specified from time to time.

In case a trading member wishes to take additional trading positions his CM is required to provide Margin deposit to NSCCL. MD can be provided by the members in the form of Cash, Bank Guarantee, Fixed Deposit Receipts and approved securities & Government securities.


Extreme loss margin:

Clearing members are subject to extreme loss margins in addition to initial margins. The applicable extreme loss margin on the mark to market value of the gross open positions is as follows or as may be specified by the relevant authority from time to time.

USDINR

EURINR

GBPINR

JPYINR

1% of the value of gross open position

0.3% of the value of gross open position

0.5% of the value of gross open position

0.7% of the value of gross open position


Contract Specifications - FUTURES


Symbol

USDINR

EURINR

GBPINR

JPYINR

Market Type

N

N

N

N

Instrument Type

FUTCUR

FUTCUR

FUTCUR

FUTCUR

Unit of trading

1 - 1 unit denotes 1000 USD.

1 - 1 unit denotes 1000 EURO.

1 - 1 unit denotes 1000 POUND STERLING.

1 - 1 unit denotes 100000 JAPANESE YEN.

Underlying / Order Quotation

The exchange rate in Indian Rupees for US Dollars

The exchange rate in Indian Rupees for Euro.

The exchange rate in Indian Rupees for Pound Sterling.

The exchange rate in Indian Rupees for 100 Japanese Yen.

Tick size

0.25 paise  or INR 0.0025

Trading hours

Monday to Friday 
9:00 a.m. to 5:00 p.m.

Contract trading cycle

12 month trading cycle.

Last trading day

Two working days prior to the last business day of the expiry month at 12 noon.

Final settlement day

Last working day (excluding Saturdays) of the expiry month. 
The last working day will be the same as that for Interbank Settlements in Mumbai.

Quantity Freeze

10,001 or greater

Base price

Theoretical price on the 1st day of the contract.
On all other days, DSP of the contract.

Theoretical price on the 1st day of the contract.
On all other days, DSP of the contract.

Theoretical price on the 1st day of the contract.
On all other days, DSP of the contract.

Theoretical price on the 1st day of the contract.
On all other days, DSP of the contract.

Price operating range

Tenure upto 6 months

+/-3 % of base price.

Tenure greater than 6 months

+/- 5% of base price.

Position limits

Clients

higher of 6% of total open interest or USD 10 million

higher of 6% of total open interest or EURO 5 million

higher of 6% of total open interest or GBP 5 million

higher of 6% of total open interest or JPY 200 million

Trading Members

higher of 15% of the total open interest or USD 50 million

higher of 15% of the total open interest or EURO 25 million

higher of 15% of the total open interest or GBP 25 million

higher of 15% of the total open interest or JPY 1000 million

Banks

higher of 15% of the total open interest or USD 100 million

higher of 15% of the total open interest or EURO 50 million

higher of 15% of the total open interest or GBP 50 million

higher of 15% of the total open interest or JPY 2000 million

Initial margin

SPAN Based Margin

Extreme loss margin

1% of MTM value of gross open position

0.3% of MTM value of gross open position

0.5% of MTM value of gross open position

0.7% of MTM value of gross open position

Calendar spreads

Rs.400 for spread of 1 month
Rs.500 for spread of 2 months
Rs.800 for spread of 3 months 
Rs.1000 for spread of 4 months and more

Rs.700 for spread of 1 month
Rs.1000 for spread of 2 months
Rs.1500 for spread of 3 months and more

Rs.1500 for spread of 1 month
Rs.1800 for spread of 2 months
Rs.2000 for spread of 3 months and more

Rs.600 for spread of 1 month
Rs.1000 for spread of 2 months
Rs.1500 for spread of 3 months and more

Settlement

Daily settlement  :  T + 1 
Final  settlement :  T + 2

Mode of settlement

Cash settled in Indian Rupees

Daily settlement price
(DSP)

Calculated on the basis of the last half an hour weighted average price.

Final settlement price
(FSP)


Wednesday, December 7, 2011

THE LEVERAGED BUY OUT DEAL OF TATA & TETLEY


THE LEVERAGED BUY OUT DEAL OF TATA & TETLEY

The case 'The Leveraged Buyout Deal of Tata & Tetley' provides insights into the concept of Leveraged Buyout (LBO) and its use as a financial tool in acquisitions, with specific reference to Tata Tea's takeover of global tea major Tetley. This deal which was the biggest ever cross-border acquisition at that time, was also the first-ever successful leveraged buy-out by any Indian company. The case examines the Tata Tea-Tetley deal in detail, explaining the process and the structure of the deal. The case helps to understand the mechanism of LBO. Through the Tata-Tetley deal the case attempts to give an understanding of the practical application of the concept.

"We were very clear that the burden on Tata tea should be such that the company would be able to absorb it. And it would not materially affect Tata Tea's bottomline."

- N.A.Soonavala, Vice-Chairman, Tata Tea.

"It was important to make the right decision on the comprehensiveness of the transaction. The model has been driven by existing and future earnings potential of the Tetley group and the resultant post-acquisition cash flows to immediately justify the business and financial model."

- Rana Kapoor, MD, Rabo India Finance Ltd., Commenting on the deal.


Introduction

In the summer of 2000, the Indian corporate fraternity was witness to a path breaking achievement, never heard of or seen before in the history of corporate India.

In a landmark deal, heralding a new chapter in the Indian corporate history, Tata Tea acquired the UK heavyweight brand Tetley for a staggering 271 million pounds. This deal which happened to be the largest cross-border acquisition by any Indian company at that time marked the culmination of Tata Tea's strategy of pushing for aggressive growth and worldwide expansion. 

The acquisition of Tetley pitch forked Tata Tea into a position where it could rub shoulders with global behemoths like Unilever and Lawrie. The acquisition of Tetley made Tata Tea the second biggest tea company in the world. (The first being Unilever, owner of Brooke Bond and Lipton).

Moreover it also went through a metamorphosis from a plantation company to an international consumer products company.

Ratan Tata, Chairman, Tata group said, "It is a great signal for global industry by Indian Industry. It is a momentous occasion as an Indian company has been able to acquire a brand and an overseas company." Apart from the size of the deal, what made it particularly special was the fact that it was the first ever leveraged buy-out (LBO) by any Indian company. This method of financing had never been successfully attempted before by any Indian company. Tetley's price tag of 271 mn pounds (US $450 m) was more than four times the net worth of Tata tea which stood at US $ 114 m. This David & Goliath aspect was what made the entire transaction so unusual. What made it possible was the financing mechanism of LBO. This mechanism allowed the acquirer (Tata Tea) to minimise its cash outlay in making the purchase.

The Tale of Tata Tea


Tata Tea was incorporated in 1962 as Tata Finlay Limited, and commenced business in 1963. The company, in collaboration with Tata Finlay & Company, Glasgow, UK, initially set up an instant tea factory at Munnar (Kerala) and a blending/packaging unit in Bangalore.

Over the years, the company expanded its operations and also acquired tea plantations. In 1976, the company acquired Sterling Tea companies from James Finlay & Company for Rs 115 million, using Rs 19.8 million of equity and Rs. 95.2 million of unsecured loans at 5% per annum interest. In 1982, Tata Industries Limited bought out the entire stake of James Finlay & Company in the joint venture, Tata Finlay Ltd. In 1983, the company was renamed Tata Tea Limited. In the mid 1980s, to offset the erratic fluctuations in commodity prices, Tata Tea felt it necessary to enter the branded tea market. In May 1984, the company revolutionized the value-added tea market in India by launching Kanan Devan tea in polypack.

In 1984, the company set up a research and development center at Munnar, Kerala. In 1986, it launched Tata Tea Dust in Maharashtra. In 1988, the Tata Tea Leaf was launched in Madhya Pradesh.

In 1989, Tata Tea bought a 52% stake in Karnataka-based Consolidated Coffee Limited-the largest coffee plantation in Asia, in order to expand its coffee business. In 1991, Tata Tea formed a joint venture with Tetley International, UK, to market its branded tea abroad. In 1992, Tata Tea took a 9.5% stake in Asian Coffee-the Hyderabad based 100% export oriented unit known for its instant coffee, through an open offer. This offer was the first of its kind in Indian corporate history. Later, in 1994, Tata Tea increased its stake in Asian Coffee to 64.5% through another open offer. This helped it to consolidate its position in the coffee industry. In 1995, Tata Tea unveiled a massive physical upgradation program at a cost of Rs 1.6 billion. The upgradation program, spread over four years, was meant to improve its production facilities. In the same year, the company, along with a Sri Lankan partner, bid successfully for a group of 20 tea estates in the famous Watawala plantations in Sri Lanka.

In 1996, Tata Tea felt the need to develop into a truly national brand. It identified an opportunity to enter the leaf tea segment in the South. Between 1996 and 1998, the company launched Tata Tea Premium in Karnataka, Andhra Pradesh, Kerala and Goa.

In December 1999, Kanan Devan was relaunched in Kerala in an entirely new pack along with a fresh advertisement campaign.  The company also planned to relaunch Kanan Devan in other markets. The new pack, with the revamped Tata logo, incorporated modern graphics with bolder branding whilst retaining the core properties associated with the brand.  The back panels on the pack were also made more interactive and informative.

To meet the demands of the American market, Tata Tea Inc. - a wholly owned subsidiary of Tata Tea  Limited  -  was  set  up  in  Florida  to  package  and  market  instant  tea  in  the  US.  The  tea  was produced  in  Tata  Tea's  factory  in  Munnar  and  then  processed  in  Florida.  The company also launched Snapple, a ready-to-drink iced tea, in the US. In 2000, it was one of the largest selling ready-to-drink teas in the US.

In  order  to  tap  the  Japanese  tea  and  coffee  market,  Tata  Tea  entered  into  a  joint  venture  with Hitachi of Japan - Tata Hitachi Sales Limited. Tata Tea had been serving as an agent for Nippon Yusen Kaisha (NYK), one of the largest shipping companies in the world. In the mid 1990s, the company  formed  a  joint  venture,  Tata  NYK,  which  aimed  at  playing  a  major  role  in  transport operations and management of seaports, inland container depots, and container freight stations.


De-Mystifying LBO

The Tata-Tetley deal was rather unusual, in that it had no precedence in India. Traditionally, Indian market had preferred cash deals, be it the Rs.10.08 billion takeover of Indal by Hindalco or the Rs. 4.99 billion acquisition of Indiaworld by Satyam.

What set the deal apart was the LBO mechanism which financed the acquisition.


LBO is defined as "acquisition of a company, financed by the borrowing of all the stocks or assets of a public limited company by a small group of investors. This buying may be sponsored by buy-out specialists  or  investment  bankers  that  arrange  such  deals  and  usually  includes  representation  by incumbent management".

Typically the buying group forms a shell corporation to act as a legal entity making the acquisition. In the stock purchase format, the target shareholders simply sell their stock and all interest in the Target Corporation to the buying group and then the two firms may be merged. In the asset-purchase format, the Target Corporation sells its assets to the buying group. The original shareholders own the target organisation,  now  merely  a  pool  of  cash  to  make  investments  with  no  tangible  assets;  the  target corporation  issues  a  liquidating  dividend  to  its  shareholders  or  becomes  an  investment  company, using  the  pool  of  cash  to  make  investments,  whose  proceeds  are  distributed  to  the  shareholders.

Sometimes the management is the prime moving force in this process; then it is called management buy-out (MBO).

In an LBO, debt financing typically represents 50% of the purchase price. The debt is secured by the assets of the acquired firm and is usually amortized over a period of less than ten years. As funds are generated by operations or from sale of assets of the acquired firm, the debt to be paid off is to be scheduled.  The  sale  of  assets  occurs  when  the  investor  group  is  motivated  to  take  control  in  part because of what it considers unwise or ill-judged acquisitions by the firm in the past.

There may also be limited equity participation on the part of outside investors such as pension funds and insurance companies, often with the provision that the equity interest will be repurchased after a pre-determined period to provide a specific yield. Following completion of the buy-out, the acquired company is usually run as a privately-held corporation rather than a public corporation, at least for a period of time, after which resale of the firm at a profit is anticipated.


The LBO seemed to have inherent advantages over cash transactions. In an LBO, the acquiring company could float a Special Purpose vehicle (SPV) which was a 100% subsidiary of the acquirer with a minimum equity capital. 

The SPV leveraged this equity to gear up significantly higher debt to buyout the target company. This debt was paid off by the SPV through the target company's own cash flows. The target company's assets were pledged with the lending institution and once the debt was redeemed, the acquiring company had the option to merge with the SPV. Thus the liability of the acquiring company was limited to its equity holding in the SPV. Thus, in an LBO, the takeover was financed by the target company's future internal accruals.  This reduced the burden on the acquiring company's balance sheet and made the entire takeover a low risk affair.

In the case of Tata Tea, its reserves at the time of the deal were just around Rs 4 billion, precluding the possibility of making such a gigantic acquisition on its own. Neither could it afford the debt burden associated with large borrowings. So, it opted for a leveraged buyout.

The deal was so structured, that although Tata tea retained full control over the venture, the debt portion of the deal did not affect its balance sheet. The liability of acquisition was limited to Tata Tea's equity contribution to the SPV. Also, the lenders had no recourse at all to Tata Tea in India.

Its dilutive impact on Tata Tea's earnings was also not substantial. One expert described it as "a classic leveraged buyout of cross-border finance, without recourse to Tata tea, secured solely upon Tetley's assets and cash flow". Interestingly, in the case of Tata Tea the deal helped satisfy it, two major requirements of financing, minimum exposure for Tata Tea but at the same time retaining 100% ownership of the company, a seemingly win-win deal indeed.


Structure of the Deal

The purchase of Tetley was funded by a combination of equity, subscribed by Tata tea, junior loan stock subscribed by institutional investors (including the vendor institutions Mezzanine Finance, arranged by Intermediate Capital Group Plc.) and senior debt facilities arranged and underwritten by Rabobank International.

Tata Tea created a Special Purpose Vehicle (SPV)-christened Tata Tea (Great Britain) to acquire all the properties of Tetley. The SPV was capitalised at 70 mn pounds, of which Tata tea contributed 60 mn pounds; this included 45 mn pounds raised through a GDR issue. The US subsidiary of the company, Tata Tea Inc. had contributed the balance 10 mn pounds. 

The SPV leveraged the 70 mn pounds equity 3.36 times to raise a debt of 235 mn pounds, to finance the deal (Refer FIGURE I). The entire debt amount of 235 mn pounds comprised 4 tranches (A, B, C and D) whose tenure varied from 7 years to 9.5 years, with a coupon rate of around 11% which was 424 basis points above LIBOR.

Of  this,  the  Netherlands  based  Rabobank  had  provided  215  mn  pounds,  while venture capital funds, Mezzanine and Shroders contributed 10 mn pounds each While A, B, and C were senior term loans, trench D was a revolving loan that took the form of recurring advances and letters of credit. Of the four tranches A and B were meant for funding the acquisition, while C and D  were  meant  for  capital  expenditure  and  working  capital  requirements  respectively (Refer TABLE 1).

The debt was raised against Tetley's brands and physical assets.  The  valuation  of  the  deal  was done  on  the  basis  of  future  cash  flows  that  the  brand  was  expected  to  generate  along  with  the synergies arising out of the acquisition.

FIGURE I

STRUCTURE OF TATA TEA'S LBO DEAL


Though the actual cost of the Tetley takeover was 271 mn pounds, Tata Tea spent another 9 mn pounds on legal, banking and advisory services and a further 25 mn pounds for Tetley's working capital requirements and additional funding plans, thereby swelling the total acquisition cost to 305 mn pounds. Since the entire securitization was based on Tetley's operations, Tata Tea's exposure was  limited  to  the  equity  component  of  only  70  mn  pounds.  Thus effectively, for just 70 mn pounds equity exposure, Tata Tea was acquiring a 264 mn pounds company.

The Way to Go?

Some analysts felt that Tata Tea's decision to acquire Tetley through a LBO was not all that beneficial for shareholders. They pointed out that though there would be an immediate dilution of equity (after the GDR issue), Tata Tea would not earn revenues on account of this investment in the near future (as an immediate merger is not planned). This would lead to a dilution in earnings and also a reduction in the return on equity. The shareholders would, thus have to bear the burden of the investment without any immediate benefits in terms of enhanced revenues and profits. From the lenders point of view too there seemed to be some drawbacks. Because of the large amount of debt  relative  to  the  equity  in  the  new  corporation,  the  bonds  were  typically  rated  below  the investment grade.

LBO  as  a  concept  did  not  seem  to  have  found  wide  acceptance  in  the  Indian  financial  system. Given  the  high  rates  of  interest  in  the  country,  such  debt  did  not  seem  to  be  forthcoming, especially since banks and financial institutions seemed interested in deploying their funds in high- return investments rather than in an LBO. Also a deal of this sort required the acquiring company's SPV to be leveraged to a far higher extent than the generally acceptable level of 1:1 to 1:2 debt- equity ratio which Indian banks and financial institutions were comfortable with.  However, inspite of  all  the  odds,  Tata  Tea's  acquisition  of  Tetley  seemed  to  have  set  a  new  benchmark  in  the corporate  Indian  history  of  cross-border  acquisitions.  It  seemed  to  have  generated  considerable interest  and  appreciation  of  the  concept,  as  a  viable  alternative  in  Indian  corporate  circles.  It remained to be seen how many would follow this new path, nuptials of the leveraged kind.

Important Notes and Terms

Tetley was the second largest brand of packaged tea in the global market, behind Unilever's Brooke Bond and Lipton brands.

The Lectic Law library's Lexicon defines a leverage buyout as "a mechanism under which a company is acquired by a person or entity using the value of the company's assets to finance its acquisition. This allows (for) the acquirer to minimise its outlay of cash in making a purchase."

Brand of Tata Tea that was very popular especially in South Indian markets. The Kanan Devan variety went back over a century and was derived from the tea growing in the Kanan Devan Hills (Tata Tea had tea estates on these hills) located in the eastern part of central Kerala and adjoining parts of Tamil Nadu. The Kanan Devan name was used for decades for selling bulk teas originating from these hills, and this led to a loose tea franchise in southern India, particularly Kerala. With the growth in the branded tea segment, Tata Tea leveraged on the name Kanan Devan to convert this loose tea franchise into a brand so as to move up the value chain.

An SPV is a company floated to act as the holding company for the purpose of acquisition in an LBO. The company is created with an equity base and this equity is leveraged along with the assets of the acquired company to fund the acquisition.

Rana Kapoor, MD, Rabo India Finance Ltd.

Tata Tea raised 45 mn pounds from 7.6 million GDR's issued at $9.87 each, in March 2000.

LIBOR  is  an  abbreviation  for  "London  Interbank  Offered  Rate,"  and  is  the  interest  rate  offered  by  a specific group of London banks for U.S. dollar deposits of a stated maturity. LIBOR is the base interest rate paid on deposits between banks in the Eurodollar market (A Eurodollar is a dollar deposited in a bank in a country where the currency is not the dollar).  It exists for various currencies and for different maturities.